Hiring statistics are important for any recruiter. No, it’s not to find the answer to the hoary question: “How many job applicants does it take to change a light bulb?” In fact, it is to stay updated with the job market that is constantly evolving with new technologies, economic conditions, and social trends.
Recruitment statistics provide valuable insights into the job and labor markets. It helps recruiters avoid costly mistakes, refine the hiring process, and find the right talent pool for their team. After all, you don’t want to end up with a quantum astrophysicist when you really need a marketing specialist.
Whether you’re looking to hire talented virtual assistants or diverse candidates for software development, this guide is for you. In this article, we’ll explore 71 hiring statistics that will sweep you off your feet and will help you better understand the US job and labor markets.
By the end of this 8-minute guide, you will have the right information about the current state of the US job market as well as practical insights into how to optimize your hiring process, increase productivity, and retain top talent.
71 Most Interesting US Hiring Statistics For Better Industry Insights
Here are our top 3 picks for the best hiring statistics:
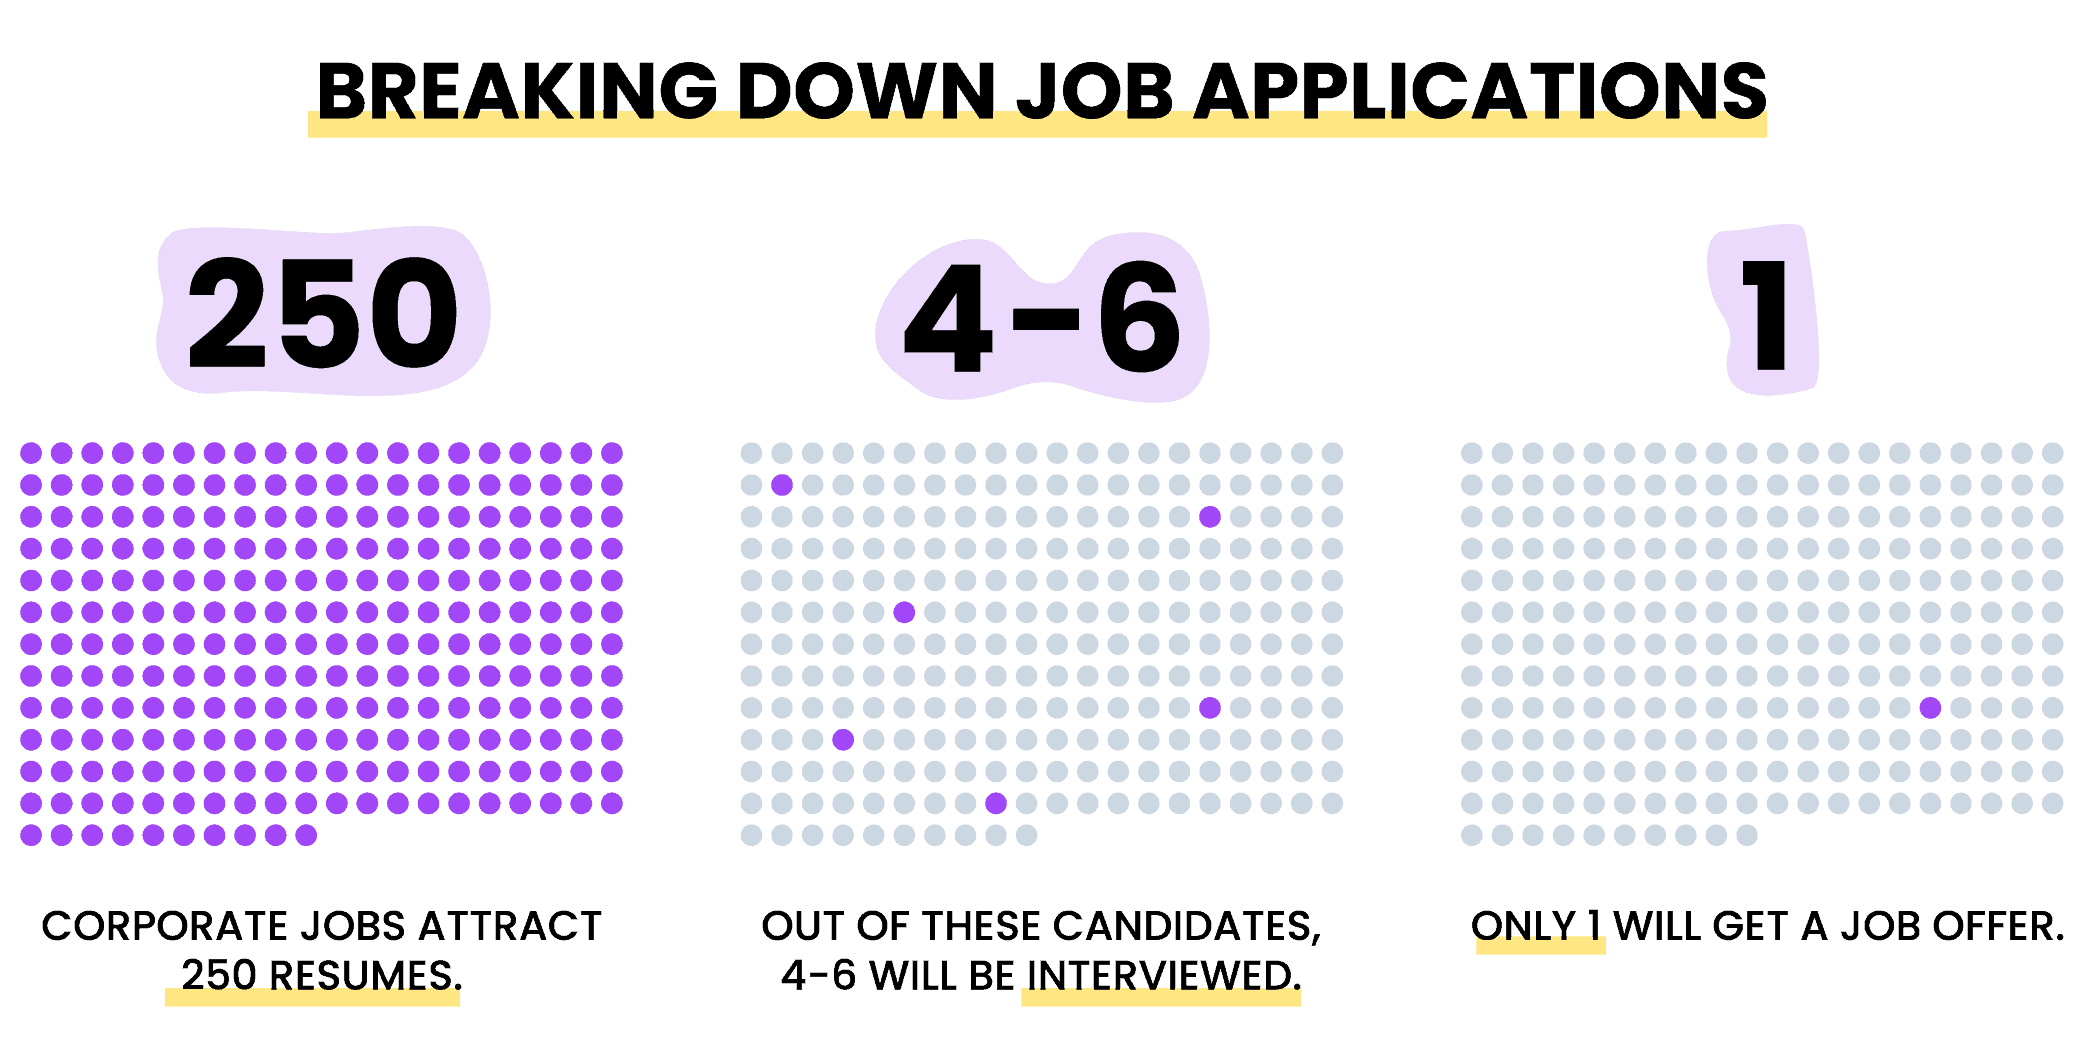
- The average job opening in the United States receives about 250 resumes but only 4 to 6 candidates will be invited to an interview and only one of those will be offered the job.
- The average cost per hire in the United States is $4,700. However, this can vary greatly depending on the industry, company size, and location.
- Remote job boards saw a 91% surge in job postings for virtual assistants, making it the second most sought-after remote job.
Let’s take a detailed look at the 71 most interesting hiring statistics to gain a better understanding of the US job market and improve your hiring strategy.
I. Current State Of The US Labor Market
Here are some stats that will give you an idea about the current situation of the US job and labor market.
1. Unemployment Rate
As of March 2023, the unemployment rate in the United States was 3.5% which is the same as the pre-pandemic rate in February 2020.
2. Job Openings
In Feb 2023, there were 9.9 million job openings in the United States which is the lowest since May 2021.
3. Labor Force Participation Rate
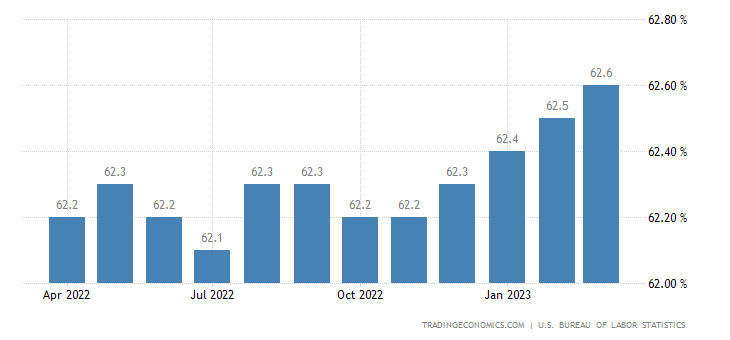
The labor force participation rate was 62.6% in March 2023. This is still lower than the pre-pandemic rate of 63.3% in February 2020.
4. Average Hourly Earnings
In March 2023, the average hourly earnings for all employees on private nonfarm payrolls was $33.18 which is an increase of 5.5% from a year earlier.
5. Long-Term Unemployment
In March 2023, 18.9% of the unemployed had been out of work for 27 weeks or longer.
6. Job Gains
In March 2023, the US economy added 236,000 jobs as hiring slows down.
II. US Virtual Assistant Industry Statistics
Let’s discuss some stats about the second most sought-after profession in the US.
7. Freelance Virtual Assistant Industry Growth
The freelance virtual assistant industry is expected to grow to $4.12 billion by 2026 at a CAGR of 11.8%.
8. Impact On Cost Saving
Hiring a virtual assistant can save businesses up to 78% on operating costs.
9. Virtual Assistant Education Level
As per the reports, 75% of virtual assistants have a college degree and 38% hold a graduate degree.
10. Impact On Small Businesses
More than 80% of small business owners said that hiring a virtual assistant has helped in their business growth.
11. Increase In Productivity
According to reports, virtual assistants can increase a business’s productivity by 30%.
12. Most Popular Virtual Assistant Platforms
As of 2023, the most popular virtual assistant platforms in the US were Zirtual, MyOutDesk, and Boldly.
 It’s no wonder Zirtual has been ranked as the best place to hire virtual assistants. At Zirtual, we only hire college graduates so that you work with people who have already gone through the rigors of higher education. It produces a more dedicated, detail-oriented, and motivated virtual assistance workforce.
But it’s not just the quality of the talent that sets us apart – it’s the vetting process. We at Zirtual are known for having one of the most rigorous vetting processes in the industry. Our virtual assistants are reliable, trustworthy, and capable of handling any task.
Zirtual invests heavily in the ongoing training and development of its virtual assistants to ensure that they are capable of doing much more than just basic administrative tasks. They’ll help you with more complex tasks that require specialized knowledge or skills – and that can translate to big profits for your business.
III. Diversity & Inclusion Statistics In Hiring
Here are some diversity and inclusion statistics that offer valuable insights into the current state of hiring in the US.
13. Disparities In Unemployment Rates Between Black & White Americans
Overall unemployment rate for individuals who identify as Black or African American was 9.2% compared to 3.2% for individuals who identify as White.
14. Higher Unemployment Rates Among Hispanic Or Latino Americans
The US unemployment rate for individuals who identify as Hispanic or Latino was 6.8% as compared to 3.2% for individuals who identify as White.
15. Individuals With Disabilities Face Higher Unemployment Rates
The unemployment rate for people with disabilities was 7.6% as compared to 3.5% for individuals without disabilities.
16. Bias Against “Black-Sounding” Names
Job applicants with “Black-sounding” names are 50% less likely to receive a callback from employers than applicants with “White-sounding” names.
17. Unemployment Rates For Asian Americans
The US unemployment rate for individuals who identify as Asian was 3.1% compared to 3.2% for those who identify as White.
18. High Rates Of Workplace Closeting
A study found that 46% of LGBTQ workers in the US are closeted at work.
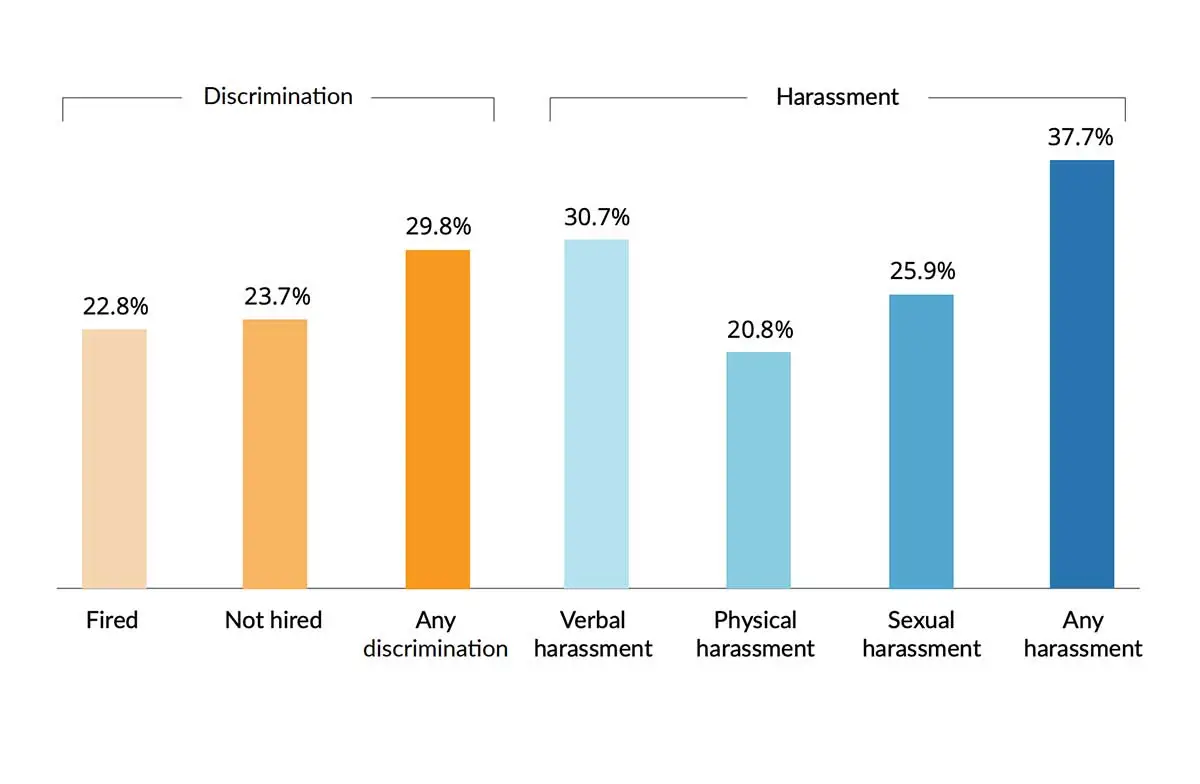
19. Transgender Workers Discrimination & Harassment
Transgender workers in the US face high rates of discrimination and harassment in the workplace with up to 90% of transgender workers experiencing mistreatment from their employers, such as being fired, denied a promotion, or harassed on the job.
IV. Important Statistics On The Demographics
Some of the important statistics on the demographics of the US job and labor market include:
20. Gender Gap
Women make up 46.6% of the US labor force while men make up 53.2%. However, women continue to face a gender pay gap, earning 82 cents for every dollar earned by men.
21. Age Distribution
The labor force participation rate of workers aged 16 to 24 years old is 55.5%, while workers aged 25 to 54 years old have a participation rate of 81.6%. Workers aged 55 years and over have a participation rate of 38.4%.
22. Educational Attainment
Approximately one-fourth of the US labor force has a bachelor’s degree or higher while 14.9% had some college or associate’s degree. Roughly 27.9% of workers had a high school diploma or less.
23. Geographic Distribution
The labor force is concentrated in urban areas with about 87% of workers living in metropolitan areas. The labor force participation rate varies by region – the South has the highest rate at 62.5%, followed by the Midwest at 61.5%, the Northeast at 59.5%, and the West at 59.2%.
24. Family Status
Approximately 71.2% of women with children under the age of 18 participated in the labor force while the participation rate for men with children under 18 was 93.3%. Additionally, the labor force participation rate for single mothers was 75% compared to 90% for married fathers.
V. Employee Turnover Statistics
Here are some employee turnover-related statistics.
25. Turnover Rate
The average overall employee turnover rate in the US was 9.3% in 2022.
26. Highest Employee Turnover Industries
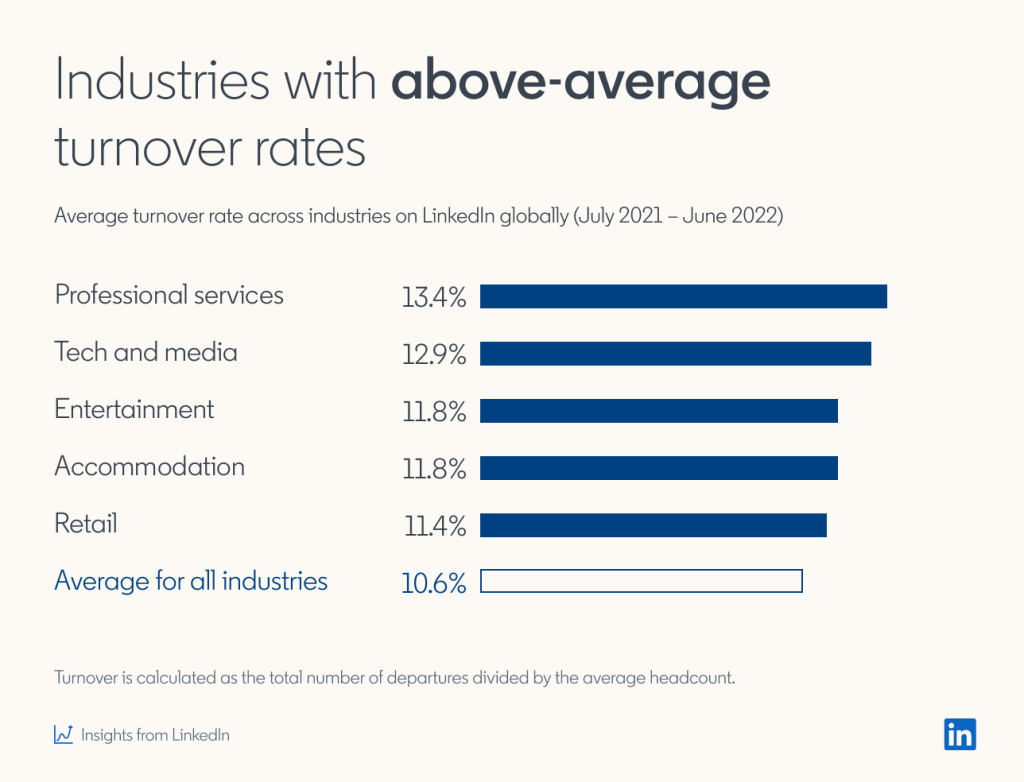
The highest turnover rates were in the professional services and tech & media industries at 13.4% and 12.9% respectively.
27. Replacement Cost
The cost of replacing an employee can range from 16% of their salary for low-paying jobs to 213% for highly specialized positions.
28. Average Tenure
The average tenure of employees in the US for 2022 was 4.1 years which was down from 4.3 years.
29. Highest Turnover Among Different Generations
Millennials have the highest turnover rate of any generation with an average of 21% leaving their jobs within a year.
30. Major Reasons For Turnover
The top reasons for employee turnover are lack of:
- Advancement opportunities
- Inadequate compensation
- Poor management
- Lack of work-life balance
VI. Employee Retention Statistics
These employee retention statistics will help you develop effective strategies to keep your employees engaged and committed.
31. Employee Engagement
A poll found that only 32% of US employees were engaged in their jobs, meaning they were emotionally invested in and committed to their work and workplace.
32. Employee Willingness To Consider New Opportunities
76% of employees would consider leaving their current job for a better opportunity even if they are passive job seekers.
33. Importance Of Flexible Work Arrangements
If provided with flexible work arrangements, 81% of employees stated that they would display greater loyalty to their employer.
34. Impact Of Employer Brand
Companies with a strong employer brand are able to reduce their turnover rates by as much as 28%.
35. Difficulty Retaining High-Performing Employees
47% of HR professionals reported that their organization had difficulty retaining high-performing employees.
VII. Remote Work Statistics
With remote work on the rise, these statistics are worth taking note of.
36. Increase In Remote Workforce
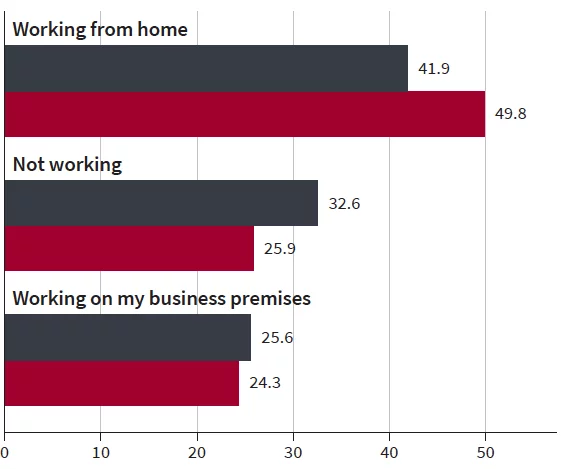
41.9% of the US labor force was working from home full-time, up from just 9% in 2019.
37. Remote Job Postings Have Increased
The number of remote job postings increased by 457% from 2020 to 2023.
38. Remote Work Is Highly Valued
74% of workers say they would quit their job if they couldn’t continue working remotely at least part of the time.
39. Remote Work is Generally Successful for Employers
83% of employers say that remote work has been successful for their company.
40. Popularity Among Younger Workers
48% of remote workers are aged 18-34 while just 30% are aged 35-54.
41. Financial Benefits For Employees
The average remote worker saved $5,240 per year on things like transportation, meals, and dry cleaning.
42. Better Work-Life Balance
67% of remote workers say they have a better work-life balance than they did when working in a traditional office.
43. Remote Work Is A Top Priority
40% of remote workers say that the ability to work remotely is more important to them than salary.
44. Fewer Sick Days
The majority of remote workers (56%) say they are less likely to take sick days.
45. Gender Differences In Remote Work Preferences
Women are more likely than men to say they prefer working from home (52% vs. 44%).
VIII. Compensation & Benefits Statistics
Let’s take a look at some key statistics related to employee compensation and benefits.
46. Strong Wage Growth in the US
The wage growth in the US was 4.2% year-over-year as of 2022, the fastest pace since 2008.
47. Average Hourly Base Salary For Virtual Assistants
The average base salary for virtual assistants is approximately $24.25 per hour.
48. Average Base Salary For Software Engineers
The median base salary for software engineers in the US is $109,000 per year.
49. Employer Contribution To 401(k) Plans
The average employer contribution to a 401(k) plan in the US is 4.5% of an employee’s salary.
50. Average Annual Cost Of Health Insurance Premiums
The average annual cost of health insurance premiums for a family in the US was $22,221.
51. Paid Time Off
The average paid time off for US employees after one year of service is 11 days.
52. Employer Student Loan Repayment Assistance
In the US, 17% of employers offer student loan repayment assistance to their employees.
53. Average Bonus Payout
The average bonus payout in the US is 11% of an employee’s salary.
54. Average Total Compensation For Private Industry Workers
The average total compensation (including benefits) for private industry workers was $34.39 per hour.
55. Employer Offered Paid Vacation Time
76% of US private employers offered paid vacation time to full-time employees.
56. Increase In Cost Of Employer-Provided Health Insurance
The cost of employer-provided health insurance for US workers has increased by 61% over the past decade.
IX. Statistics On Recruiting Trends
Here are some statistics on the latest recruiting trends.
57. Employer Branding Is Crucial
72% of recruiting leaders in the US agree that employer branding significantly impacts hiring.
58. Employee Referrals Are A Top Source Of Hires
Employee referrals account for 30% of all hires in the US.
59. Diversity And Inclusion Are Top Priorities
76% of active job seekers say that a diverse workforce is an essential factor when considering job opportunities.
60. Power Of Social Media
84% of organizations use social media for recruiting and 9 out of 10 recruiters have hired someone through LinkedIn.
61. Easy Process
60% of job seekers have quit an application process because it was too long or complicated.
62. Skill Shortages Are A Major Challenge
69% of employers in the US report difficulty filling jobs due to talent shortage.
X. Technology & Hiring Statistics
Let’s take a look at how technology has affected the US job and labor market.
63. Increase In Demand For Tech Jobs
A 25% growth in demand for software developers is projected from 2021 to 2031 which is much faster than the average for all occupations.
64. Companies Investing In Technology
A survey found that 92% of executives reported investing in digital transformation over the past year.
65. Impact Of Automation On Jobs
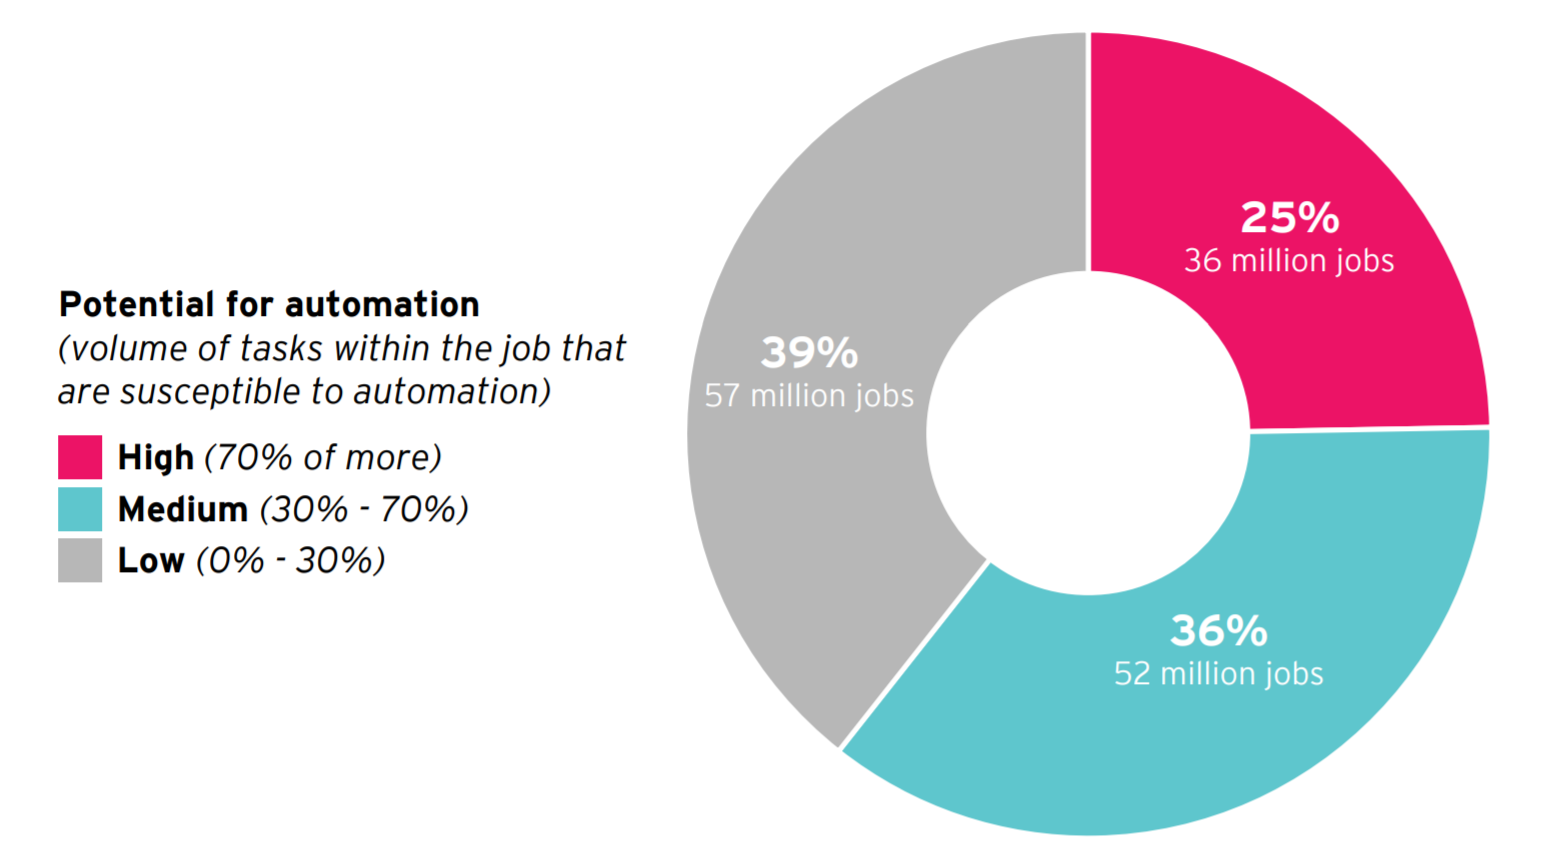
It is estimated that around 25% of US jobs are at a high risk of being automated with lower-wage jobs being the most vulnerable.
66. Importance Of Upskilling
A survey found that 77% of CEOs in the US consider upskilling their workforce as their top priority for closing the skills gap in their organization.
67. Role Of AI In Hiring
66% of CEOs believe that AI will drive significant value in HR over the next few years, including improved hiring decisions.
68. Video Interviewing
67% of job seekers have participated in a video interview and 86% of recruiters use video interviews to assess job candidates.
69. Applicant Tracking Systems (ATS)
75% of recruiters and hiring managers use applicant tracking software to streamline their recruitment process.
70. Online Assessments
According to a study, 71% of employers use online assessments to screen job candidates with cognitive ability tests being the most commonly used.
71. Virtual Job Fairs
The number of virtual job fairs increased by 300% in 2023 as more companies looked for ways to connect with job seekers remotely.
Conclusion
It is time that recruiters and hiring managers recognize that the job market is constantly evolving. They must benefit from these hiring statistics to be proactive in their approach to attracting and retaining skilled candidates. All things aside, employers need to focus on creating a positive company culture as it significantly impacts job offers, employee retention, and overall productivity.
Also, passive talent is a valuable resource that employers should consider. A large percentage of potential candidates are not actively into job searching but they might be open to considering a new job offer if the right opportunity arises.
Zirtual’s virtual assistants can make a big difference to your hiring endeavors. With our team of highly-skilled virtual assistants, we can help streamline your recruitment process by handling administrative tasks, scheduling interviews, and sourcing potential candidates from a range of job boards and platforms.
Our virtual assistants make sure that you don’t miss out on valuable resources in the job market by reaching out to candidates on social media, building relationships, and promoting your company’s brand and culture. Book a consultation with us today and feel the Zirtual difference.
Sources
US Bureau of Labor Statistics Source 1
US Bureau of Labor Statistics Source 2
US Bureau of Labor Statistics Source 3
Society For Human Resource Management Source 1
Society For Human Resource Management Source 2